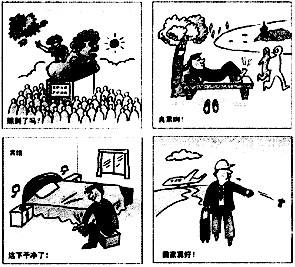
 题目内容
(请给出正确答案)
题目内容
(请给出正确答案)
[主观题]
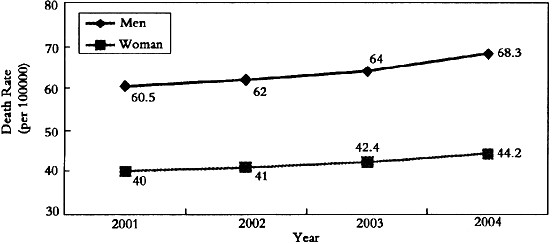
Part BBelow is a graph showing the changes in the number of passengers in a subway station
Part B
Below is a graph showing the changes in the number of passengers in a subway station in Paris. Look at the graph and write an essay of about 120 words that describes the information conveyed in the graph.
 答案
答案
查看答案