 题目内容
(请给出正确答案)
题目内容
(请给出正确答案)
[主观题]
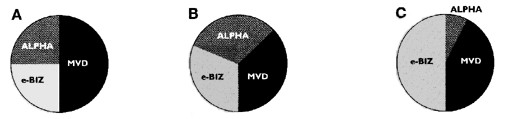
Which pie chart shows the market share of Sontec and its competitors?A.B.C.
Which pie chart shows the market share of Sontec and its competitors?
A.
B.
C.
 答案
答案
查看答案
 请输入或粘贴题目内容
搜题
请输入或粘贴题目内容
搜题
 拍照、语音搜题,请扫码下载APP
题目内容
(请给出正确答案)
拍照、语音搜题,请扫码下载APP
题目内容
(请给出正确答案)
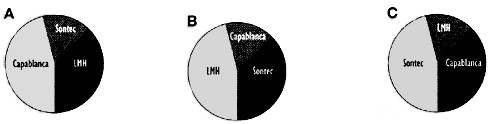
Which pie chart shows the market share of Sontec and its competitors?
A.
B.
C.
答案
 更多“Which pie chart shows the market share of Sontec and its competitors?A.B.C.”相关的问题
第1题
You are to write a report of 160--200 words for a university lecturer describing the information shown below.
A Survey on Adult Education
.jpg)
第4题
?Look at the pie chart on which you have made some notes.
?Using your notes, write your report which will summarize the information below and try to give some reasons for the distribution.

?Write 120-140 words.
第5题
? For questions 1-8 you will hear eight short recordings.
? For each question, mark one letter (A, B or C) for the correct answer.
? You will hear the eight recordings twice.
Which pie chart is correct?

A.
B.
C.
第6题
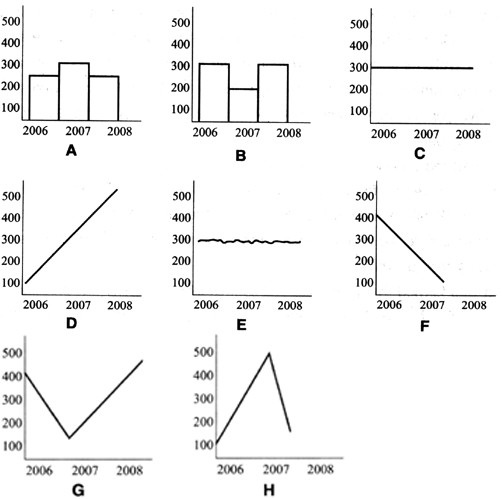
● Look at the charts below. They show computer sales.
● Which chart does each sentence (11-15) describe?
● For each sentence, mark one letter (A-H) on your Answer Sheet.
● Do not use any letter more than once.
.jpg)
There was no change until the end of the period, when computer sales rose sharply.
第7题
● Look at the charts below. They show the profits of a company.
● Which chart does each sentence (11-15) describe?
● For each sentence mark one letter (A-H) on your Answer Sheet.
.jpg)
After a sharp fall in 2000, company profits recovered slightly the following year.
第8题
● Look at the charts below. They show company profits.
● Which chart does each sentence (11—15) describe?
● For each sentence mark, mark one letter (A—H) on your Answer Sheet.
● Do net use any letter more than once.
.jpg)
After a sharp drop in 1999, profits recovered for twelve months and then fell again in 2001.
第9题
● Look at the charts below. They show company sales.
● which chart does each sentence (11-15) describe?
● For each sentence, mark one letter (A-H) on your Answer Sheet.
● Do not use any letter more than once.
.jpg)
Sales didn't change from 1998 to 2000.
第10题
Questions 11-15
&8226;Look at the charts below. They show company sales.
&8226;Which chart does each sentence (11-15) describe?
&8226;For each sentence, mark one letter (A-E) on your Answer Sheet.
&8226;Do not use any letter more than once.
Sales didn't change from 2006 to 200