 题目内容
(请给出正确答案)
题目内容
(请给出正确答案)
[主观题]
Part BBelow is a graph showing the average number of hours a student spends on the compute
Part B
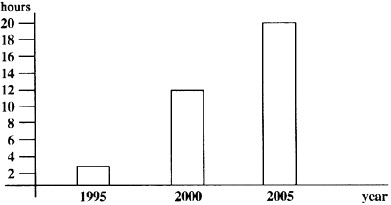
Below is a graph showing the average number of hours a student spends on the computer per week. Look at the graph and write an essay of about 120 words making reference to the following points:
(1)The change of the hours a student spends on the computer per week from 1995 to 2005;
(2) The possible reasons of the change and the problems and difficulties college students face when they use computers.
 答案
答案
查看答案